Data provided by Johns Hopkins University - Baltimore, Maryland US
Dashboards updated daily
We watch closely as Coronavirus spreads across the United States
Data provided by Johns Hopkins University - Baltimore, Maryland US
Dashboards updated daily
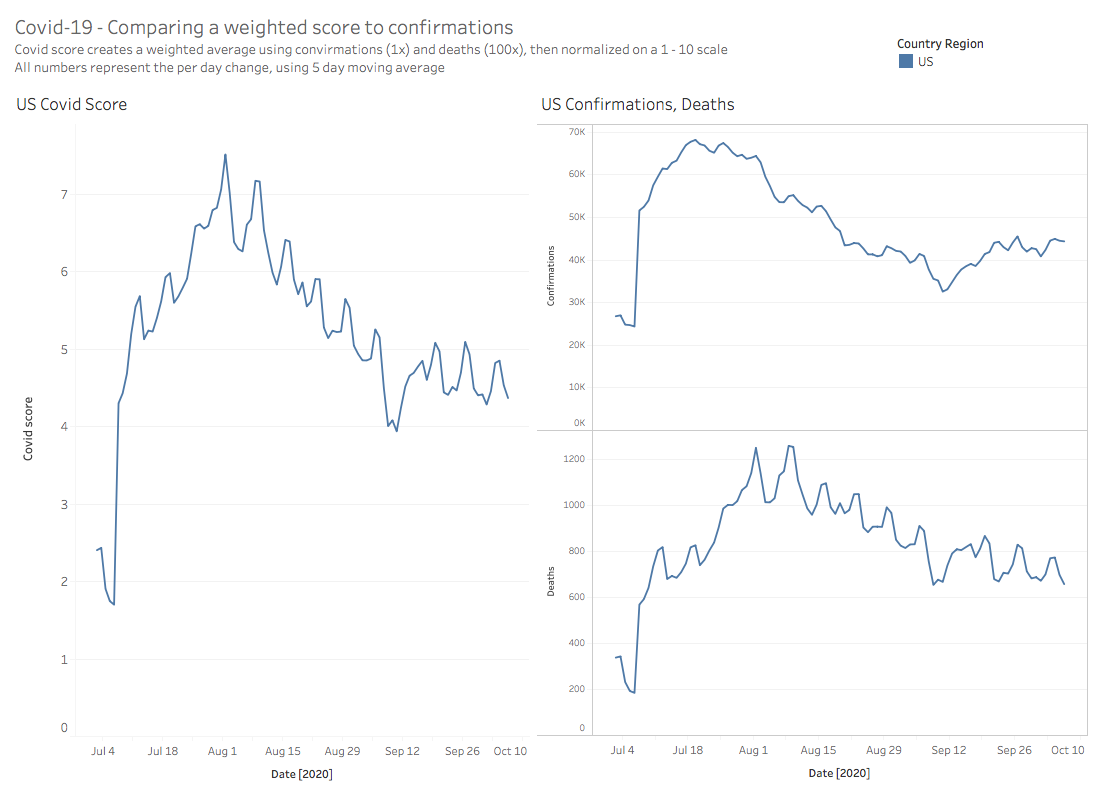
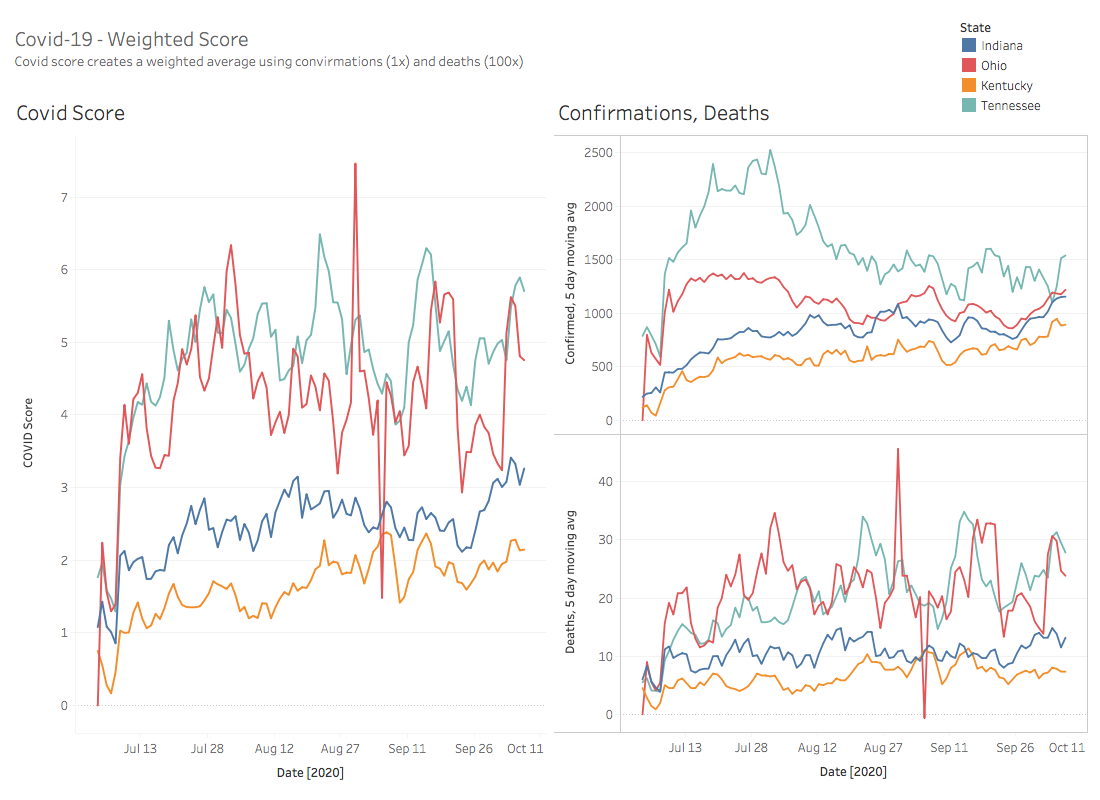
As we all continue to focus, rightly so, on the Covid-19 outbreak it's bothered me for some time that we (society) have become very focused on largely a single data metric; confirmations. I believe as with most things of high complexity it takes many metrics to ascertain the current state.
Many may disagree with my logic, but I have put together a simple weighted average using: confirmations, hospitalizations, and deaths. The following weights are used confirmations (1x), hospitalizations (10x), deaths (100x); i.e. ((1c + 10h + 100d) / 111). My logic is that a covid hospitalization is some level more significant than a confirmation, and a covid death is some level more significant than a hospitalization. In the visuals the focus is the change rate over time.
Additionally I converted the score to 0 to 10 scale to make it more logical to review and compare to other subsets of the united states. A score of 0 would indicate no covid confirmations, hospitalizations, or deaths; a score of 10 would indicate a very high risk with a large number of individuals impacted.
** update **, as of 8/28 Johns Hopkins data set has pulled hospitalization data; I contacted them and it was done for a variety of reasons but mainly do to inconsistant reporting. I have now modified the calculations to exclude hospitalizations, but continue the same weights for confirmations and deaths.